Menu Engineering: The Matrix to Know Which Dishes Are Profitable
Apply menu engineering using the popularity×margin matrix. Identify which dishes are stars, puzzles, workhorses, or dogs and optimize your menu to increase profits.

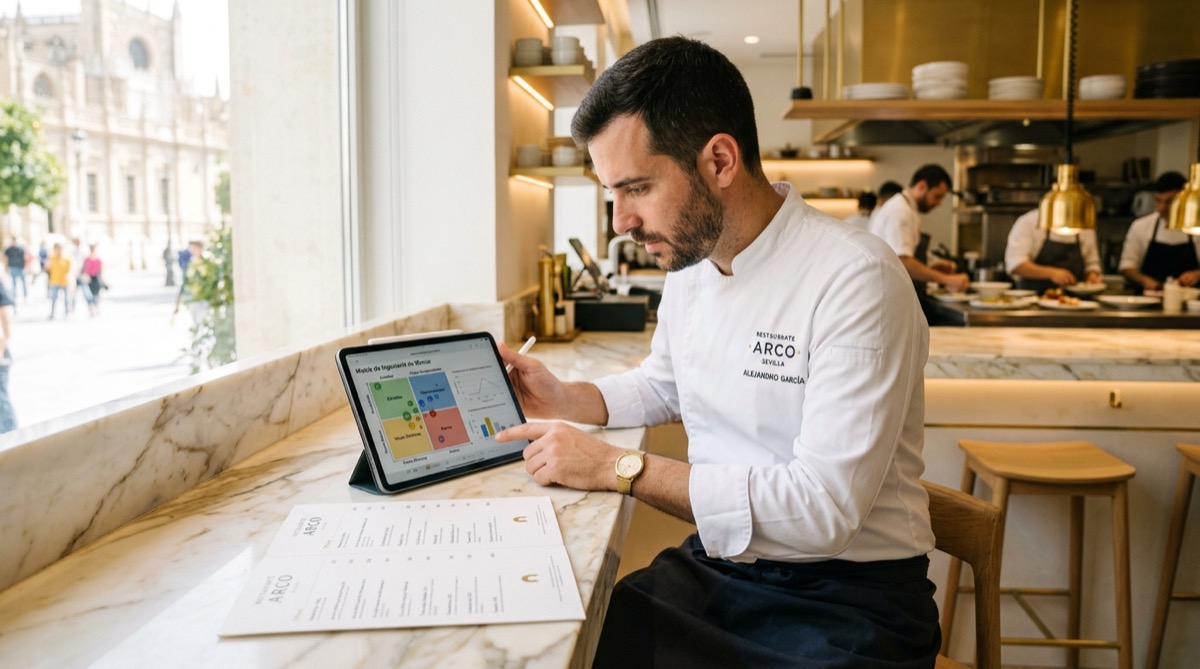
Your menu is much more than a list of dishes: it’s your primary sales tool. But if you only look at gross margin or only at units sold, you’re seeing half the story. Menu engineering crosses both variables to tell you, with data, which dishes deserve a place of honor on your menu and which ones you should retire this very week.

In this article, I’ll explain step by step how to build the popularity×margin matrix, calculate the thresholds, interpret each quadrant, and make decisions that increase your profitability. With a real example of a menu with 8 dishes so you can replicate it tomorrow.
AI Chef Pro · AI for chefs55+ AI tools for your kitchenCreate recipes, menus and optimize costs free. Try AI Chef Pro now.Try it free →What is menu engineering and why do you need it?
Menu engineering is a menu profitability analysis methodology developed by Kasavana and Smith in the 1980s. Its brilliance lies in the fact that it doesn’t stop at the contribution margin (selling price minus food cost), but crosses it with the actual popularity of each dish.
Because a dish with an 80% margin that only 2% of diners order isn’t making you rich. And a best-selling dish with a razor-thin margin might be cannibalizing other more profitable ones.
The matrix classifies each reference into one of these four quadrants:
- Stars: high popularity, high margin. Your jewels.
- Workhorses: high popularity, low margin.
- Puzzles: low popularity, high margin.
- Dogs: low popularity, low margin.
The goal is not to have only stars —that’s impossible— but to consciously manage the mix to maximize the restaurant’s total margin.
How to calculate the popularity and margin thresholds
Before classifying, you need two cut-off lines. Without clear thresholds, the matrix is pure guesswork.
Popularity threshold
Popularity is measured as the percentage of units sold of a dish over the total dishes sold in the analyzed period.
Formula:
Popularity (%) = (Units sold of the dish / Total menu units sold) × 100
The threshold is calculated as follows:
Popularity threshold = 100% / Number of dishes in the analyzed category
If you analyze a menu of 8 main courses, the threshold is 100 / 8 = 12.5%. Any dish exceeding that percentage is considered high popularity; below, low popularity.
Important: analyze by categories (starters, mains, desserts). Don’t mix apples and oranges. A starter never competes in popularity with a main course.
Margin threshold
The contribution margin is the difference between the selling price (excluding VAT) and the food cost (recipe costing) of the dish.
Unit margin = Selling price excl. VAT − Food cost
The threshold is simply the weighted average margin of the whole category:
Margin threshold = Sum of (Unit margin × Units sold) / Total units sold
Or, more simply: you calculate the total margin generated by each dish (margin × units), sum everything and divide by the total units sold.
If a dish has a unit margin above that average, it’s high margin. If below, low margin.
If you need to fine-tune the calculation of selling price and margins before diving into the matrix, I recommend reviewing our guide on calculating selling price and margins in hospitality.
Practical example: matrix for a menu of 8 main courses
Let’s go with real numbers. Imagine you have a menu of 8 main courses in your restaurant. Here are the sales and recipe costing data for the last month (selling price excl. VAT):
| Dish | Units sold | Food cost (€) | Selling price excl. VAT (€) | Unit margin (€) | Total margin (€) | Popularity (%) |
|---|---|---|---|---|---|---|
| Iberian sirloin with foie gras | 42 | 9.80 | 24.00 | 14.20 | 596.40 | 9.2% |
| Red tuna tataki | 68 | 7.50 | 22.50 | 15.00 | 1,020.00 | 14.9% |
| Boletus and truffle risotto | 55 | 3.20 | 16.50 | 13.30 | 731.50 | 12.1% |
| Confit cod with pilpil sauce | 73 | 5.10 | 18.00 | 12.90 | 941.70 | 16.0% |
| Braised pork cheeks in red wine | 90 | 3.80 | 14.50 | 10.70 | 963.00 | 19.7% |
| Ox burger | 85 | 4.20 | 13.90 | 9.70 | 824.50 | 18.6% |
| Homemade pesto pasta | 24 | 1.80 | 11.00 | 9.20 | 220.80 | 5.3% |
| Iberian pork secreto with mojo sauce | 19 | 4.60 | 17.50 | 12.90 | 245.10 | 4.2% |
| TOTALS | 456 | — | — | — | 5,543.00 | 100% |
Calculating the thresholds
Popularity threshold: 100% / 8 dishes = 12.5%
Margin threshold: Total margin (€5,543) / Total units (456) = €12.16
Now we classify each dish according to whether it exceeds both thresholds:
| Dish | Popularity | vs 12.5% | Unit margin | vs €12.16 | Quadrant |
|---|---|---|---|---|---|
| Iberian sirloin with foie gras | 9.2% | ❌ Low | €14.20 | ✅ High | Puzzle |
| Red tuna tataki | 14.9% | ✅ High | €15.00 | ✅ High | Star |
| Boletus and truffle risotto | 12.1% | ❌ Low | €13.30 | ✅ High | Puzzle |
| Confit cod with pilpil | 16.0% | ✅ High | €12.90 | ✅ High | Star |
| Braised pork cheeks in red wine | 19.7% | ✅ High | €10.70 | ❌ Low | Workhorse |
| Ox burger | 18.6% | ✅ High | €9.70 | ❌ Low | Workhorse |
| Homemade pesto pasta | 5.3% | ❌ Low | €9.20 | ❌ Low | Dog |
| Iberian pork secreto with mojo | 4.2% | ❌ Low | €12.90 | ✅ High | Puzzle |

What to do with each quadrant: decisions that increase your margin
Having the picture is great, but what truly transforms your profit and loss statement is what you do with that information.
Stars: pamper them, don’t touch (too much)
The tuna tataki and confit cod are your cash generators. High demand and high margin. Here the strategy is clear:
- Premium placement on the menu: page opening area, highlighted box, photography if you use it.
- Specific training for the front-of-house team so they know them inside out and recommend them passionately.
- Don’t play with price increases without testing. One extra euro can cool demand and ruin their status.
- Ensure consistency: the worst enemy of a star is one bad day that disappoints a regular customer.
Workhorses: optimize without killing demand
The braised pork cheeks and ox burger are your bestsellers, but with margin below average. They are the dishes that fill the dining room and build loyalty. Don’t eliminate them abruptly; work on them with surgical precision:
- Review the recipe costing: can you reduce the cost by 30-50 cents without the customer noticing? Change the garnish, adjust portion sizes, negotiate with suppliers.
- Controlled price increase: a €1.00-1.50 increase in the pork cheeks (from €14.50 to €15.90) would barely affect its popularity if the perceived value is high.
- Try upselling: suggest a star starter or a high-margin dessert to compensate for the lower margin of the main course.
- Strategic placement: place them near the stars so the customer sees them, but the eye goes first to what interests you most.
Puzzles: the hidden potential you don’t know how to sell
The Iberian sirloin, boletus risotto, and Iberian pork secreto have excellent margins but low turnover. Here you have an untapped goldmine. The problem isn’t the dish; it’s your ability to sell it:
- Change the menu description: don’t write “Iberian sirloin with foie gras”. Write “Grilled acorn-fed Iberian sirloin with caramelized foie gras escalope and Pedro Ximénez reduction”. Selling starts with the text.
- Specific front-of-house training: do internal tastings of these dishes. Have the waiter taste them and know how to tell their story.
- Try as a special off the menu for two weeks. If it works, consolidate it.
- Visually reposition them: if they are at the end of the menu, move them up. The diner’s eye scans in a Z or F pattern; puzzles need to be in that path.
- If after two months they don’t pick up, consider rotating them out of season or eliminating them. A puzzle that doesn’t move is a storage cost and waste.
Dogs: eliminate or transform radically
The pesto pasta has low popularity and low margin. It’s the dish that doesn’t add but subtracts: it occupies mental space for the customer, kitchen space, and prep time.
- First option: eliminate. Ruthlessly. If you’ve had this data for three months, out it goes.
- Second option: reformulate. If you think there’s a niche of customers who ask for it (vegetarians, children), change the recipe to increase the margin (cheaper but tasty ingredients) and test a slightly higher price.
- Third option: move to a set menu or special offer. This way it doesn’t contaminate your main menu but you still have an outlet for it if needed.
Common mistakes when applying menu engineering
I’ve seen dozens of restaurants apply this matrix and stumble over the same stones. Avoid them:
- Analyzing periods that are too short. One week is not representative. Minimum one month, ideally three months to smooth out holiday or long weekend peaks.
- Not separating by categories. Comparing the popularity of a salad with a ribeye is absurd. Each category has its own threshold.
- Using the gross margin percentage instead of the contribution margin in euros. This mistake is serious. An €8 dish with an 80% margin leaves you €6.40 in the till. A €22 one with 60% leaves you €13.20. The margin in euros rules, not the percentage.
- Eliminating workhorses suddenly. They bring in customers. If you remove them without a plan, your average ticket can plummet.
- Not updating the matrix after changes. You did your homework, moved the pieces… and you don’t measure again. Menu engineering is cyclical: analyze, act, measure, act again.
- Setting the selling price without real cost criteria. If the selling price is not based on an updated recipe cost, the whole matrix collapses. To calculate the optimal selling price for each dish with accurate data, you can use our dish selling price calculator.
How to automate this analysis (and not die in Excel)
Doing this by hand every month with 40 items is torture. The secret is to have:
- Updated recipe costings with the real cost of each ingredient.
- Sales records per dish (the POS gives you this).
- A tool that cross-references both data and draws the matrix automatically.
In Miselup, the recipe costing and technical data sheets software used by hundreds of restaurants in Spain, the menu engineering matrix generates itself by cross-referencing your recipe costs with sales data. This way you can make weekly decisions without spending hours in front of a spreadsheet.
ChefBusiness · Real profitabilityMaximize your restaurant without losing moneyCost control and food marketing. Book your ChefBusiness consulting now.Get the consulting →Frequently Asked Questions
How often should I do menu engineering?
It is advisable every month during the first six months of implementation. Once the menu is stabilized, you can switch to a quarterly analysis. In seasonal hospitality (beach bars, summer terraces), do it before the season starts and one month later to adjust.
Can I apply the matrix if I have a very short menu, with only 5 or 6 dishes?
Yes, perfectly. With 5 dishes the popularity threshold is 20%. The logic is the same. In fact, in short menus the analysis is even more revealing because each dish has a huge weight in the total margin.
What do I do if a dish is right on the threshold, without clearly falling into any quadrant?
If a dish dances on the border (for example, popularity of 12.4% with a 12.5% threshold), treat it with caution. Observe its trend over two consecutive months. If it’s on the rise, move it toward the strategy of the upper quadrant (puzzle → star). If it’s declining, make decisions from the lower quadrant.
Is menu engineering useful for the drinks and wine list?
Absolutely. The category analysis is exactly the same: red wines, whites, cocktails, beers… Each group with its own threshold. You’ll be surprised to discover which references are true dogs that only take up space in the cellar. And in a tapas bar, where the same dish is sold as a tapa, half and full portion, this matrix pairs well with solid recipe costing for a tapas bar to fine-tune the margin of each format.
Is high margin or high popularity better?
The balance is in the stars, but if you have to prioritize, high margin. A dish with low popularity but high margin (puzzle) has growth potential if you work on sales. A dish with high popularity and low margin (workhorse) is already at its demand ceiling and you can only improve its profitability by touching costs or price, with the risk that entails.