My recipe costing adds up but I'm losing money: the 3 gaps to profitability
Your recipe costing adds up and theoretical food cost is 30%, but there is no profit at month-end. The 3 gaps between a good costing and a profitable P&L.

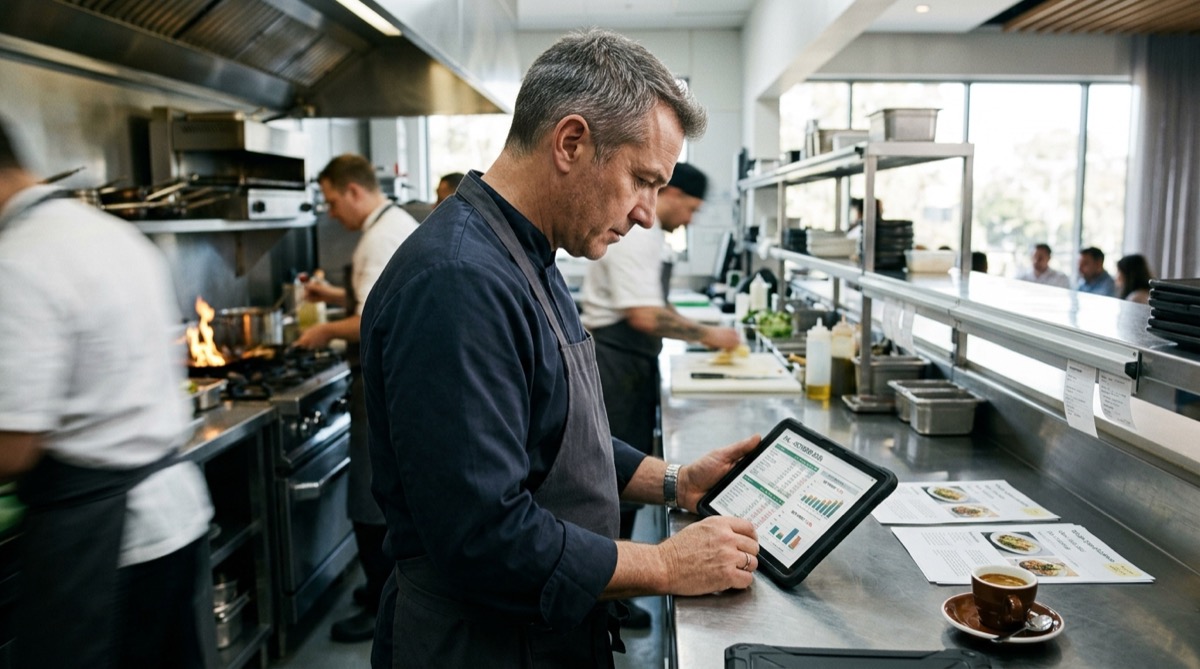
It’s been a while since I stopped counting the number of times a hospitality owner tells me: “John, my recipe costings are spot on, my theoretical food cost gives me a healthy 30%, and yet at the end of the month there’s not a penny left in the till.” And I’m not talking about someone who wings it: I’m talking about chefs, pastry chefs, bakers, baristas and bartenders who weigh every gram, calculate every trim loss, and have impeccable spec sheets. But the profit just doesn’t show up.
That frustration is real, and it’s not a problem of a poorly done costing. It’s something deeper: the recipe costing measures the dish, but money is made or lost in the business as a whole. There are three silent gaps between “my costing adds up” and “my P&L shows a profit,” and in this article we’re going to open them up without pulling any punches. Because this isn’t another sermon about food cost: it’s about understanding why a good costing doesn’t automatically make you profitable.
AI Chef Pro · AI for chefs55+ AI tools for your kitchenCreate recipes, menus and optimize costs free. Try AI Chef Pro now.Try it free →The recipe costing measures the dish; profitability is measured in the business
I’ll be direct: when you cost a recipe, you answer a very specific question: how much does the raw material for this dish cost me? You add up weights, multiply by purchase prices, factor in trim losses, and get a cost per portion. That number is your portion-level food cost, and it’s essential for setting selling prices and controlling the kitchen. If you don’t do it, you’re navigating blind. Knowing how to cost a recipe step by step is the foundation of any self-respecting hospitality business.
But your business’s profitability answers a much broader question: what’s left in the bank at the end of the month after paying for EVERYTHING? That’s no longer a recipe costing; it’s a profit and loss statement (P&L) at the business level. This is where labour costs, rent, utilities, taxes, platform commissions, marketing, bookkeeping fees come in… and also, of course, the raw material you actually consumed, not what you calculated on paper.
A perfect recipe costing is a necessary but not sufficient condition. You can have the tightest theoretical food cost in the world and still lose money if the other numbers don’t add up. The classic mistake is confusing the dish margin with the business margin. And that confusion costs thousands of euros every month.
Gap 1: your theoretical food cost is not your actual food cost
The first hole through which money escapes lies between the ideal world of your costings and the real world of your inventory. I call it the food cost gap.
Your theoretical food cost is the sum of all your recipe costings: you take each recipe, multiply it by the units sold (according to the POS or kitchen report), and get a raw material cost “on paper.” It’s a clean, tidy number that usually matches what you expect.
But the actual food cost comes from the inventory: what you bought, minus what you have left at the end of the month, adjusted for internal transfers. That number includes the real life of the workshop or kitchen: the trim loss you didn’t weigh, the portion that went out a bit generous because the chef “eyeballed it,” the product that expired before being used, the cold-room discrepancy, the petty theft (which exists, painful as it is), purchasing errors… All of that lives outside the spec sheet.
When you compare both numbers, the distance is money that evaporates. And the worst part is you don’t see it in any recipe costing.
Look at this realistic example:
| Concept | Theoretical food cost | Actual food cost |
|---|---|---|
| Data source | Sum of recipe costings | Actual inventory |
| Signature dish (raw material cost) | €3.60 | €4.32 |
| % of selling price ex-VAT (€12.00) | 30% | 36% |
| Gap | — | +6 points |
In this case, your costing said that dish cost €3.60 in raw materials, 30% of the selling price. But the reality of the storeroom and production is screaming at you that it cost €4.32, 36%. Those 6 points of difference are not a calculation error: they are operational leaks that no recipe costing detects. And if you sell 1,000 units of that dish a month, those extra €0.72 per portion turn into €720 that disappear from your net profit.
That’s why I insist so much that food cost is controlled with the inventory, not with the recipe costing. The costing gives you the target; the inventory gives you the truth. If you only look at the first, you’re living in an accounting fiction. I recommend diving deeper into the difference between theoretical vs actual food cost and using our food cost calculator to automate this comparison and see the gap instantly.
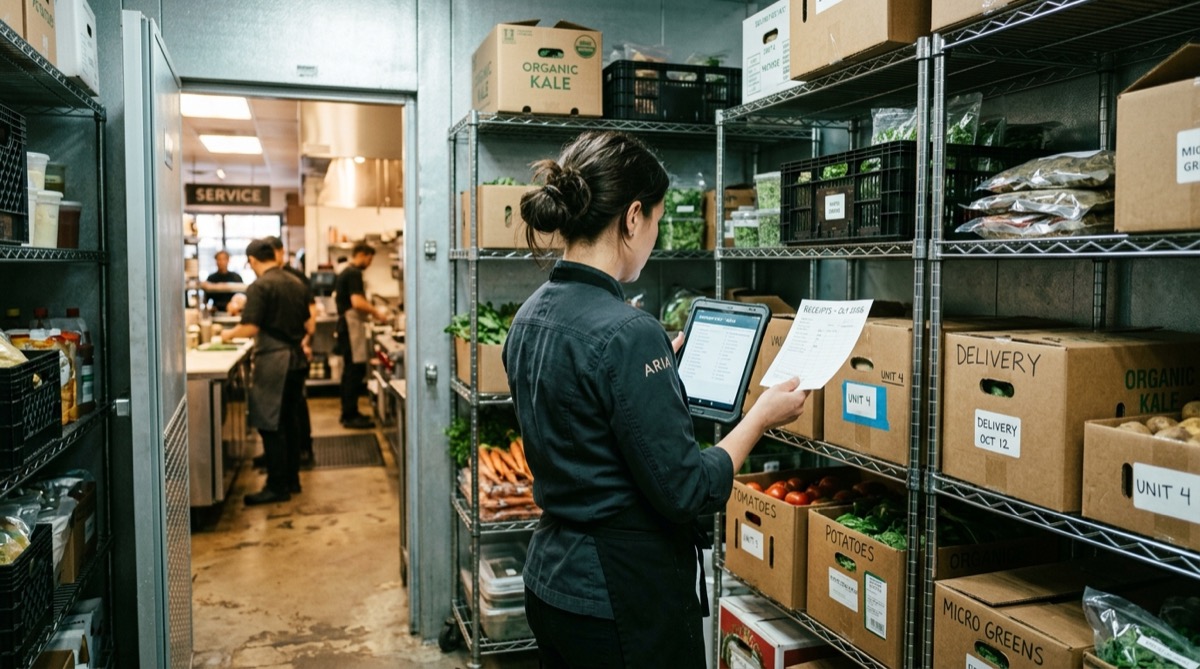
Gap 2: the recipe costing doesn’t see your fixed costs
Even if you close the previous gap and manage to make your actual food cost match the theoretical one (or come very close), there’s a second step that the costing doesn’t cover: fixed and structural costs.
The recipe costing, by definition, only loads the raw material of the dish. But that dish doesn’t cook itself, serve itself, or sell itself. Behind it is a chef (or a barista, or a pastry chef) earning a wage; a premises paying rent; electricity keeping the cold rooms running; gas heating the oven; public liability insurance; a bookkeeper handling your taxes; a card terminal charging you commissions… None of those costs appear on your spec sheet.
That’s why a 30% food cost doesn’t mean you have a 70% profit. That 70% is gross margin, yes, but you still have to subtract everything else. And if you don’t, you live with the illusion that you’re making money when in reality you’re working to pay bills.
To make it clear, here’s a typical mini-P&L for a hospitality business turning over €100,000 a month (net sales ex-VAT). The percentages are based on that figure:
| Line item | % of sales |
|---|---|
| Actual food cost | 36% |
| Labour | 30% |
| Rent and occupancy | 10% |
| Utilities and other | 16% |
| Net profit | 8% |
Notice: with an actual food cost of 36% (which already includes the leaks from Gap 1), labour costs of 30% (very tight for hospitality), rent at 10%, and other utilities and operating expenses at 16%, the net profit is just 8%. That is, for every 100 euros that come in, only 8 are real profit. And that’s in a scenario that’s no disaster: it’s the reality for many well-managed businesses.
Now, remember the 6 points of leakage we saw in Gap 1. If that business had kept food cost at the theoretical 30% (without the inefficiencies), the net profit wouldn’t be 8%, but 14%. Almost double. That’s the difference between “just getting by” and “this is a healthy business.”
That’s why you need to go beyond the recipe costing and understand the complete cost structure of a restaurant. Because the dish doesn’t just pay for the raw material: it also pays for the roof, the team, and the time of the person who makes it.
Gap 3: below the break-even point, it doesn’t matter how good your costing is
There’s a reality that hits without warning: you can have impeccable costings, a theoretical food cost nailed to the cent, and dishes that leave a 70% gross margin, and still watch your bank account drain. The reason is simple: you’re selling below the break-even point.
The break-even point is the minimum sales volume you need each month to cover all your costs, fixed and variable. When you don’t reach that threshold, opening the doors costs you money every day, even if every dish coming out of the kitchen has a healthy margin. Here the problem isn’t the costing; it’s the volume.
To understand it, you need to master the concept of contribution margin. It’s the actual amount each ticket leaves in the till after paying its own variable costs (raw materials, packaging, platform commissions). That contribution is what goes towards covering fixed costs and, once covered, generating profit.
The break-even formula is:
Break-even point = Fixed costs / Contribution margin per ticket
Let’s go to a concrete example, with real figures I see every week in business controls:
- Monthly fixed costs (core staff, rent, utilities, insurance, bookkeeping): €12,000
- Average ticket ex-VAT: €22
- Variable costs per ticket (actual food cost 36% + packaging and commissions 4% = 40%): €8.80
- Contribution margin per ticket: €22 − €8.80 = €13.20 (60% of the ticket)
With those numbers, the break-even point is: €12,000 / €13.20 = 909 tickets per month, which equates to approximately 35 covers per day over 26 service days.
Now look at what happens in three different scenarios with those same fixed and variable costs:
| Scenario | Covers/day | Tickets/month | Contribution margin | Monthly result |
|---|---|---|---|---|
| Below | 30 | 780 | €10,296 | −€1,704 (loss) |
| Break-even | 35 | 909 | €12,000 | €0 |
| Above | 40 | 1,040 | €13,728 | +€1,728 (profit) |
Look closely: with 30 covers a day you lose €1,704 per month even if your costings are perfect and your theoretical food cost stays at 30%. The dish is well calculated, the business isn’t. Because the recipe costing doesn’t fill the dining room or cover fixed costs; sales volume does that.
That’s why I insist so much that calculating the break-even point isn’t an academic exercise: it’s the number that tells you how many customers you absolutely need for the business to stay afloat. If you don’t know it and monitor it every week, you’re flying blind. Here’s the complete guide on how to calculate a restaurant’s break-even point and the break-even calculator I’ve prepared so you can do it in seconds.
Summarising this third gap: below the break-even point, it doesn’t matter how good your costing is; you don’t sell enough to cover the structure, and that shortfall appears as a final loss without your dish spec sheet being able to warn you.

From recipe costing to P&L: how to close the three gaps
At this point, the conclusion is clear: the recipe costing is the starting point, not the finish line. It tells you how much a dish costs, but it doesn’t tell you if the business is making money. For that, you need to stop looking only at the spec sheet and start reading a profit and loss statement with all three gaps controlled simultaneously.
What does that mean in practice?
- Cross-check theoretical and actual food cost every month with a serious inventory, so Gap 1 doesn’t steal your margin without you noticing.
- Allocate fixed costs across services and dishes to understand the full cost and set a selling price that defends profitability, which is what Gap 2 addresses.
- Monitor whether you are above or below the break-even point, because without sufficient volume, the healthiest margin turns into a loss, as we saw in Gap 3.
That’s exactly what a daily P&L control does: it transforms your recipe costings into a living profit and loss statement, where every day you know how much you’ve sold, what real margin you’ve generated, and whether the business is on track to cover its structure or heading off the rails. If you want to see how this approach compares with other cost-management tools, here’s the Miselup vs TSpoonLab comparison.
In my daily work, I help hospitality owners connect those dots with tools that do the heavy lifting for you. For example, Miselup naturally links the recipe costing with the daily P&L, so you can see on a single screen whether your dishes cover what they should and whether the business is holding up. No juggling with Excel, no depending on the accountant to give you numbers two months late. That automatic recalculation the moment a purchase price changes is what I call dynamic recipe costing: the only way a costing that’s accurate today stays accurate three months from now. I invite you to explore how to calculate selling price and margins with a logic that goes from the dish to the net result.
Because in the end, that’s what it’s about: the recipe costing tells you how much a dish costs; the P&L tells you whether you have a business.
ChefBusiness · Real profitabilityMaximize your restaurant without losing moneyCost control and food marketing. Book your ChefBusiness consulting now.Get the consulting →Frequently asked questions
1. Why am I losing money if my recipe costing is well done?
Because the costing only captures the raw material cost of the dish. It doesn’t consider fixed costs (rent, labour), possible unrecorded waste, or sales volume. If you don’t reach the break-even point, a perfect costing coexists with a negative P&L.
2. Does the recipe costing include labour and rent costs?
No. A standard costing includes only the ingredients and, at most, packaging. Labour, rent, utilities, and insurance are fixed costs that you must allocate separately to obtain the full cost of a dish or service.
3. What is the difference between theoretical and actual food cost?
Theoretical is what the raw material should cost according to your spec sheets and recipes. Actual is what you have effectively consumed after counting opening inventory, purchases, and closing inventory. The difference is due to trim losses, theft, weighing errors, or recipes not being followed.
4. How many covers do I need to avoid losing money?
It depends on your fixed costs and your contribution margin per ticket. In the article’s example, with €12,000 in fixed costs and a margin of €13.20 per ticket, you need 35 covers a day. Calculate your own threshold with the formula: fixed costs / margin per ticket.
5. How often should I review my recipe costings?
Review them at least at the start of each season and every time you negotiate prices with suppliers. If there are frequent changes in raw material costs, a monthly review is ideal to adjust the selling price before the margin deteriorates.
6. Does a good food cost guarantee my restaurant will be profitable?
No. A controlled food cost is necessary, but not sufficient. Profitability also requires that sales volume exceeds the break-even point, that fixed costs are proportionate, and that the total gross margin covers the structure. Food cost is just one piece of the puzzle.