Restaurant costs: complete structure, target percentages and sample income statement
Cost structure of a restaurant: each line with its target percentage of sales, summary table and a sample income statement that balances.


I’ve spent over fifteen years walking into other people’s kitchens with a scale, an Excel spreadsheet and a promise not to judge. In all that time, I’ve come across a pattern more common than yesterday’s bread: owners who know the cost of their signature dish down to the cent but have no idea what their business actually costs them. They know the sirloin costs them €4.50 a portion, but they ignore that between delivery fees, the partner’s self-employed social security and the heated terrace’s electricity, that dish doesn’t leave them a cent. Today we’re going to give each item in a restaurant’s cost structure a name, a surname and – above all – figures. No magic, no misleading averages, and an income statement that balances to the last cent.
AI Chef Pro · AI for chefs55+ AI tools for your kitchenCreate recipes, menus and optimize costs free. Try AI Chef Pro now.Try it free →What restaurant costs are and why sizing them (not just classifying them) decides your profit
Restaurant costs are all the economic resources you consume to generate your sales. Food cost, labor, rent, electricity, commissions… Everything. The mistake I see in most businesses is not that they don’t know what they spend, but that they don’t know how much each item weighs against their real sales.
Classifying costs into fixed and variable is fine for passing a hospitality exam. Sizing them – assigning a target percentage of your net sales and a euro amount – is what lets you make decisions when the bank calls, when it’s time to refresh the menu or when you wonder whether that third server on the lunch shift is a luxury or a necessity.
The dish cost is not the business cost
Knowing the food cost of each dish is the starting point. Knowing how to cost a dish step by step is an obligation, not a virtue. But the recipe costing only gives you one of the many numbers you need to sleep easy. I’ve audited restaurants with an impeccable 29% food cost that lost money every month because the rent ate 18% of the till and the staffing was overblown. The dish cost is one piece; the full structure is the puzzle. If you only look at food cost, you’re driving with your eyes fixed on the odometer. And if your business is catering or events, this logic shifts even further: cost is worked out per guest and there are event line items to allocate, as I explain in the guide to recipe costing for catering and events.
Fixed, variable and semi-variable costs: a quick definition
Before we get into numbers, a brief note. Fixed costs are those you pay whether you sell or not: rent, insurance, software subscriptions, accounting fees. Variable costs fluctuate with your activity level: food cost, delivery commissions, cleaning products. Then there are semi-variable costs, those with a fixed minimum and a part that grows with sales: electricity (you have a base load from fridges and an extra when the kitchen is at full tilt) or casual staff on weekends.
To understand how these costs determine your viability, you need to calculate your restaurant’s break-even point. I won’t repeat that calculation here, but burn this into your memory: your break-even point is the minimum revenue you need so that the sum of all your costs doesn’t leave you in the red. If you don’t know it, you’re flying blind.
The cost structure line by line (with target % of net sales)
Let’s get to the point. All the figures that follow are always calculated on net sales excluding VAT. In Spanish hospitality, the general VAT rate is 10%, so when I talk about net sales, I mean what your business actually keeps after deducting that 10% that belongs to the taxman, not to you.
Food cost / cost of goods sold (28-35%)
Food cost is the cost of the food and drink you sell. The healthy range moves between 28% and 35% of your net sales. Below 28%, either you’re a purchasing genius or – more likely – you’re sacrificing quality and the customer will notice. Above 35%, your gross margin narrows dangerously and any deviation in another line sends you into a loss.
Watch out: I mean actual food cost, not theoretical. Theoretical food cost is what your recipe costing says you should spend; actual food cost is what comes out when you count what you bought, what you threw away, what spoiled and what disappeared. If you want to understand why those two numbers almost never match, I’ll leave you the article on the difference between theoretical and actual food cost. And if you need to calculate it quickly, use our food cost calculator.
Labor (30-35%, INCLUDING employer social security)
Here’s the trap most restaurateurs fall into: they calculate labor cost using only gross wages and forget that employer social security contributions add about 30-32% on top of each salary. A chef you pay €1,800 gross actually costs your business around €2,400 a month. So when I say labor cost should be between 30% and 35% of net sales, I’m talking about total labor cost: gross wages, social security, end-of-contract indemnities, uniforms and training. Everything. If you want the full breakdown — how to go from gross salary to real employer cost, the target ratio by business type, and how to control it daily — I cover it in the guide on restaurant labor cost.
If your restaurant turns over €50,000 a month, your labor cost shouldn’t exceed €16,500 monthly (33%). Go over that threshold consistently and you’ll enter the pain zone.
Prime cost: the sum the profitable ones watch most closely (≤60-65%)
Prime cost is the sum of food cost + labor. It’s the most reliable thermometer of a restaurant’s operational efficiency. The goal is to keep it below 60-65% of sales. A prime cost of 60% or less is excellent; up to 65% is acceptable. Sustained above 65%, you’re in the danger zone: you lack the margin to pay rent, utilities and everything else.
On the €50,000/month example, a 63% prime cost (30% food cost + 33% labor) leaves you €18,500 to cover the rest of the expenses. If that post-prime-cost margin drops below 35%, your net profit evaporates.
Rent (6-10%)
Rent should be between 6% and 10% of your net sales. The ideal target is 6-8%. If your venue turns over €50,000 a month, your rent should not exceed €4,000. When I audit a restaurant and see rent at 12% or more, I know the business is working for the landlord, not the owner. In prime areas of Madrid or Barcelona, I know this percentage gets tight, but if it structurally exceeds 10%, you need a turnover well above average for the numbers to work.
Utilities: electricity, water and gas (2-5%)
Electricity, water and gas should come in between 2% and 5% of sales. In a business doing €50,000/month, we’re talking about roughly €2,000. Electricity is usually the lion’s share of this line, especially in electric kitchens or venues with heated terraces. If your utility bill exceeds 5%, review rates, consumption times and equipment efficiency. I’ve seen monthly savings of €400 just by changing the contracted power and adjusting oven start-up times.
Other operating expenses: marketing, accounting, insurance, maintenance, POS/delivery commissions (8-10%)
This is the catch-all line that many underestimate. It includes: POS and delivery platform commissions (which can take between 15% and 35% of each order), marketing and social media, accounting, insurance (public liability, multi-risk, business coverage), equipment maintenance, cleaning products, replacement smallwares, software licences, training and a long etcetera. In total, this line usually weighs between 8% and 10% of sales. In our example, about €4,500 a month. If you don’t control it, it slips through the cracks and throws your income statement out of balance.
Depreciation, financial costs and taxes
Depreciation reflects the wearing out of your assets (machinery, furniture, fit-out) and normally accounts for 2-3% of sales. Financial costs (loan interest, credit lines) vary greatly depending on your debt level, but a reasonable benchmark is to keep them below 2%. Then there’s Corporation Tax, which in Spain is 25% on pre-tax profit. In a well-managed structure, tax takes about 2% to 3% of sales.
Summary table: cost structure with target percentages 2026
So you can see it at a glance, here’s the restaurant cost table with target percentages and their euro translation for a business turning over €50,000 net per month (€600,000 per year):
| Line | Target % of sales | € per month (on €50,000) |
|---|---|---|
| Food cost | 28-35% | 15,000 |
| Labor (incl. employer SS) | 30-35% | 16,500 |
| Rent | 6-10% | 4,000 |
| Utilities (electricity, water, gas) | 2-5% | 2,000 |
| Other operating expenses | 8-10% | 4,500 |
| Depreciation + financial | 4-5% | 2,250 |
This table isn’t decoration; it’s your roadmap. Each month, compare your real figures against these targets. If a line deviates by two percentage points, find out why before the hole gets bigger.
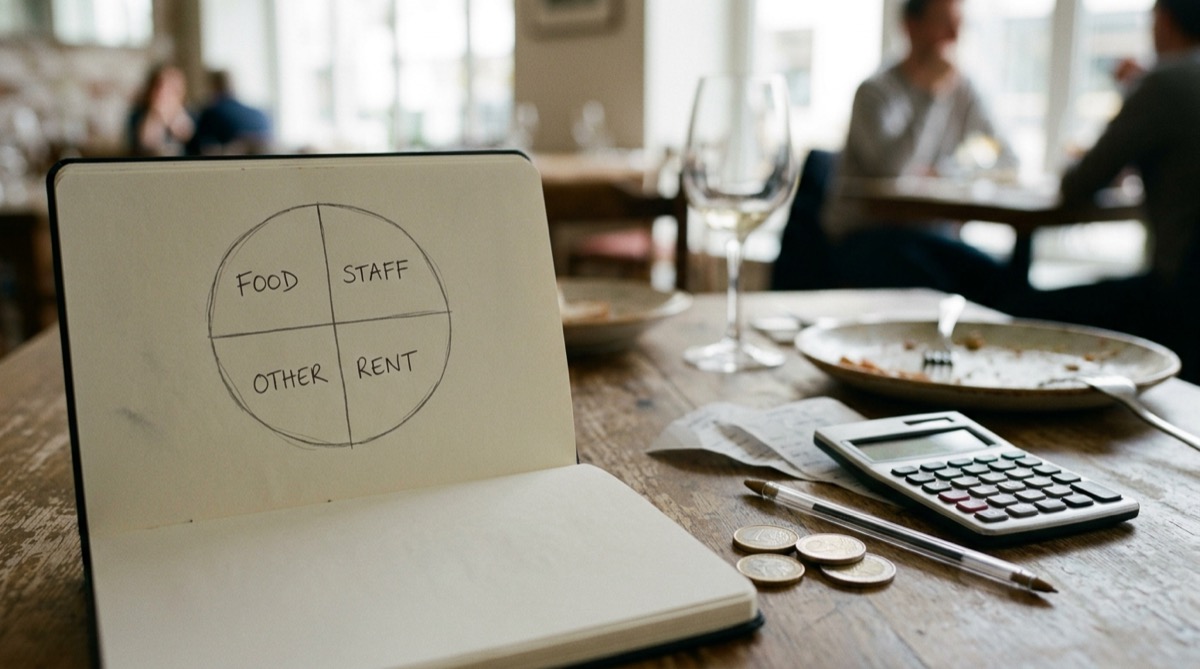
Opening costs vs recurring costs: the initial investment almost no one adds up correctly
One thing is what it costs to run a restaurant month by month, and quite another is what it costs to open one. I meet too many entrepreneurs who confuse the initial investment with the monthly expense, and that mistake they pay for with cash-flow stress in the first six months.
Opening costs (CAPEX): the one-off investment
Restaurant opening costs are investments you make once and then depreciate over the life of the business. They aren’t first-month expenses; they’re the price of admission. The main components:
- Leasehold, rental deposit or premises purchase: can range from a few thousand euros for a modest leasehold to several hundred thousand in prime areas.
- Fit-out, renovation and licences: adapting the premises, technical project, opening and activity licence. Surprises are common here: a poorly sized extraction hood can cost you an unplanned €15,000 extra.
- Kitchen and equipment: ovens, plancha, fryers, fridges, industrial dishwasher, extraction hood. The heart of your operation.
- Furniture and décor: tables, chairs, bar, lighting, ambience.
- Crockery, cutlery and smallwares: plates, glasses, cutlery, pots, pans, utensils. It seems little until you add it all up.
- POS, software and website: point-of-sale system, management software, website, digital menu.
- Initial stock of food and drinks: the first purchase to fill the pantry and the cellar.
- Cash reserve for the first months: the most forgotten item. You need liquidity to pay wages, suppliers and rent while the business ramps up and reaches cruising speed. Budget at least three months of full operating expenses.
There is no single figure for how much it costs to open a restaurant. It depends on size, location, concept and whether you start with an already fitted-out unit or a bare shell. But be clear: we’re talking tens of thousands of euros in the best case, and several hundred thousand in the more realistic one.
Recurring costs (OPEX): what you pay each month
These are all the restaurant expenses we detailed in the structure above: food cost, labor, rent, utilities, operating costs, financial costs and taxes. These are what determine your monthly income statement and what you must watch like a hawk.
The margins: gross, contribution, net and EBITDA
Let’s clarify concepts because I see a lot of confusion:
- Gross margin: net sales minus food cost. If your food cost is 30%, your gross margin is 70%. That’s what you have left to pay for everything else.
- Contribution margin: net sales minus variable costs (food cost + commissions + casual labor + other variables). It’s what contributes to covering your fixed costs. Don’t confuse it with gross margin; they’re distant cousins.
- EBITDA: earnings before interest, taxes, depreciation and amortization. It’s your ability to generate operating cash. In a healthy restaurant, EBITDA runs between 10% and 15% of sales.
- Net margin or net profit: what’s left after paying absolutely everything, including taxes. In hospitality, a net margin of 3% to 8% is realistic and healthy. Aiming higher is fine, but don’t beat yourself up if you’re in that range.
Sample income statement that balances (euro case study)
Let’s build a full restaurant income statement with real, verified figures. I’m taking the example of a full-service restaurant with annual net sales of €600,000 (€50,000 per month):
| Line | % of sales | € / year |
|---|---|---|
| Net sales | 100% | 600,000 |
| − Food cost | 30% | 180,000 |
| = Gross margin | 70% | 420,000 |
| − Labor (incl. employer SS) | 33% | 198,000 |
| = Margin after prime cost (prime cost 63%) | 37% | 222,000 |
| − Rent | 8% | 48,000 |
| − Utilities | 4% | 24,000 |
| − Other operating expenses | 9% | 54,000 |
| = EBITDA | 16% | 96,000 |
| − Depreciation | 2.5% | 15,000 |
| = EBIT (operating profit) | 13.5% | 81,000 |
| − Financial costs (interest) | 2% | 12,000 |
| = Pre-tax profit | 11.5% | 69,000 |
| − Corporation Tax (25%) | 2.9% | 17,250 |
| = NET PROFIT | 8.6% | 51,750 |
Check: 180,000 + 198,000 + 48,000 + 24,000 + 54,000 + 15,000 + 12,000 + 17,250 + 51,750 = €600,000. It balances to the cent. This is the kind of income statement you should have framed (or better, kept alive and updated every month).
Well-managed scenario vs industry average
Now, let’s take the more common case: the average industry restaurant. Raise food cost to 33% and labor to 35%. Prime cost shoots up to 68%. What happens? The post-prime-cost margin shrinks to 32%, EBITDA falls from 16% to 11% and final net profit plummets from 8.6% to barely 5%. Five points of prime cost have eaten almost half of your profit. That’s how fragile profitability is in hospitality.
Benchmarks 2026: how much costs weigh by type of venue
Not all restaurants play in the same league. The percentage of costs in a restaurant varies by business model. Here are the net margin ranges I usually work with:
- Fine dining / full-service: 3-10%. Tight margins because food cost is high and service is labor-intensive.
- Bars and cafés: 10-20%. Drinks (with much higher margins than food) pull the load.
- Pizzerias: 15-20%. Cheap ingredients and efficient processes.
- Fast food: 2-9%. High volume but razor-thin unit margins.
Gross turnover matters less than the model. I’ve seen neighbourhood bars turning over €200,000 a year with an 18% net margin, and trendy restaurants doing a million with a 2% profit. Don’t compare by what you bring in; compare by what you keep.
How to reduce your costs without damaging the dish (levers by line)
Cutting costs isn’t about tightening screws blindly. It’s knowing which levers to pull in each line without the customer noticing:
- Food cost: negotiate with suppliers by volume, control waste rigorously (I’ll leave you the guide to controlling kitchen waste), review menu engineering to push the highest-margin dishes, and use a tool to calculate selling price and margins accurately.
- Labor: optimize shifts according to demand curves, cross-train for off-peak hours, review productivity per employee. Sometimes one fewer cook and a well-trained commis deliver more than two overlapping chefs.
- Rent: if you’re above 10%, renegotiate with the landlord or ask yourself whether the current premises are viable. It hurts, but it hurts more to bleed every month.
- Utilities: switch to LED lighting, review contracted power, install timers on equipment, negotiate rates with energy suppliers.
- Operating expenses: audit delivery commissions (sometimes it’s more profitable to boost dine-in with an offer), review insurance policies annually, automate management with software to cut accounting hours.
From Excel to daily control: your cost structure only works if you watch it every night
A cost structure in Excel is a snapshot. And a snapshot in hospitality ages in 24 hours. Real control isn’t calculating your percentages at month-end when there’s no room for manoeuvre, but watching each line every night. That’s where a daily P&L – fed by your recipe costings and your real sales data – becomes your best tool.
Because having food cost under control isn’t enough if the rest of the structure runs away from you. You can have a 29% food cost and still lose money if your prime cost hits 68% because staffing is oversized. The break-even point isn’t a figure you calculate once a year; it’s a traffic light you should check every week. If you want to stop flying blind, the daily P&L from Miselup gives you that visibility without needing to be a finance expert. And if you don’t have it yet, start for free and begin looking at your numbers with the same eyes you use to look at your dishes.
ChefBusiness · Real profitabilityMaximize your restaurant without losing moneyCost control and food marketing. Book your ChefBusiness consulting now.Get the consulting →FAQ about restaurant costs
What are the costs of a restaurant and what percentage does each represent?
The main restaurant costs and their target percentages of net sales are: food cost (28-35%), labor including social security (30-35%), rent (6-10%), utilities (2-5%), other operating expenses (8-10%) and depreciation plus financial costs (4-5%). The resulting net profit usually falls between 3% and 8%.
How much does it cost to run a restaurant per month in Spain?
It depends on the turnover volume, but on an example of €50,000 in monthly net sales, restaurant expenses total approximately €45,700 per month, split between food cost (€15,000), labor (€16,500), rent (€4,000), utilities (€2,000), other operating costs (€4,500), depreciation and financial costs (€2,250) and corporate income tax (≈€1,450). Net profit would be around €4,300 per month.
What is the difference between fixed and variable costs in a restaurant?
Fixed costs are those you pay regardless of your sales level (rent, insurance, accounting, software subscriptions). Variable costs fluctuate with your activity (food cost, delivery commissions, casual staff). There are also semi-variable costs, like electricity, which have a fixed minimum and a portion that grows with consumption.
What is the prime cost of a restaurant and how much should it be?
Prime cost is the sum of the two largest operating costs: food cost plus labor (including employer social security contributions). It’s the key efficiency indicator. The goal is to keep it below 60-65% of net sales. A prime cost of 60% or less is considered excellent; sustained above 65% puts the business in the danger zone.
How much should labor cost be in a restaurant?
Total labor cost (gross wages plus employer social security, which adds approximately 30-32%, plus other labor costs) should be between 30% and 35% of net sales. The most common mistake is calculating only gross wages and forgetting the employer’s social security contribution.
What are the costs of opening a restaurant (initial investment)?
Opening costs (CAPEX) include: leasehold or rental deposit, fit-out and licences, kitchen equipment, furniture and décor, crockery and smallwares, POS and software, initial stock of ingredients and a cash reserve for the first months. These are one-off investments that can range from tens of thousands to several hundred thousand euros depending on size, location and condition of the premises.
How can I reduce my restaurant costs without losing quality?
Act line by line: food cost – negotiate with suppliers and control waste; labor – optimize shifts based on real demand; rent – renegotiate if it exceeds 10% of sales; utilities – review rates and energy efficiency; operating expenses – audit delivery commissions and automate processes with management software.
Why does my restaurant have high turnover but low profit or losses?
Because gross revenue doesn’t guarantee profitability. If your cost structure is unbalanced – for example, a prime cost above 65%, rent above 10% or delivery commissions eating your margin – you can have high sales and still lose money. Net profit in hospitality rarely exceeds 8% of sales; a two-point deviation in prime cost can wipe out half of your profit.
How often should I review my restaurant’s cost structure?
The full cost structure should be reviewed every month at the accounting close. But the key lines – food cost and labor cost – should be monitored daily or at most weekly. A daily P&L lets you catch deviations before they turn into month-end losses, and it’s one of the restaurant KPIs worth watching every day.