Kitchen Trim Waste: How to Calculate It (Standard Yield Loss Table)
Learn how to calculate trim waste in the kitchen and take control of your food cost with our standard yield loss table for fish, meat, and vegetables. Optimize your profitability!

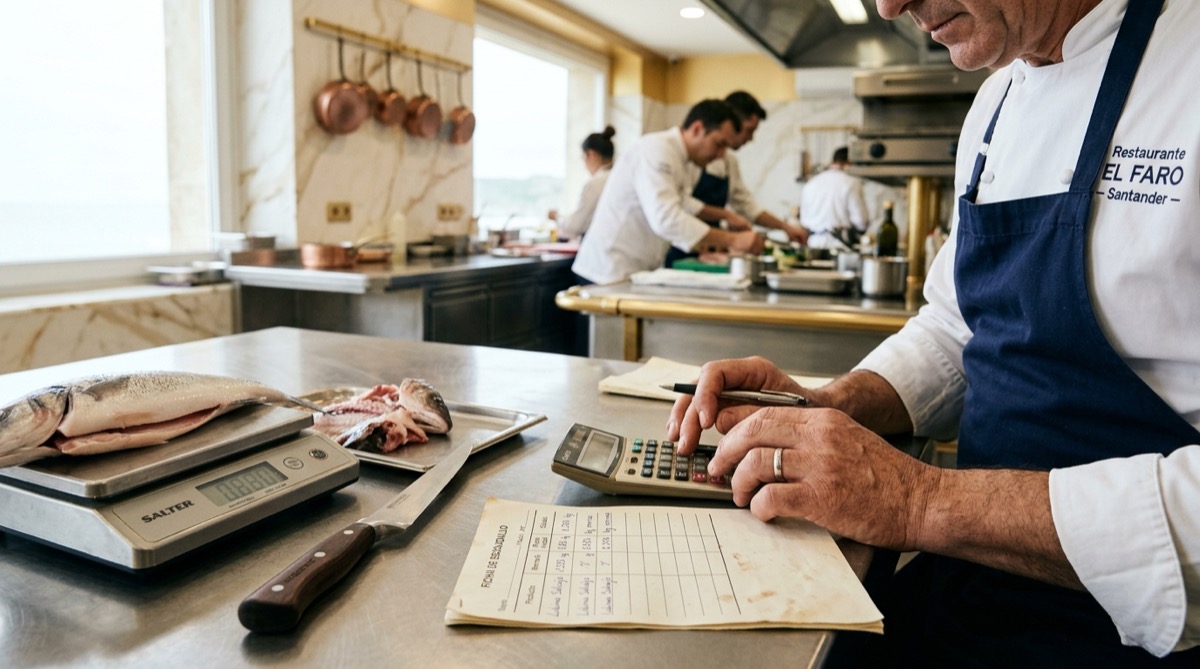
If you’ve ever watched a dish’s margin evaporate without really knowing why, welcome to the club. Kitchen trim waste is that silent thief that strikes every time you clean a fish, trim fat from a cut of meat, or cut the stalks off artichokes. And no, it’s not just an anecdote: it’s a data point that, if left unchecked, skews your recipe costing and sends your real food cost soaring. Let’s put some numbers to it, with euro-based examples and a standard yield loss table that will serve as your reference for fine-tuning your technical sheets.

What Exactly Is Trim Waste in the Kitchen?
Trim waste is the loss of weight or volume an ingredient undergoes from the moment it enters your kitchen in its raw state until it is ready to be plated. That difference between what you buy and what you actually use translates directly into lost money if you don’t factor it into your calculations.
Think of a 2 kg wild turbot. When your supplier delivers it, it’s whole, with head, guts, and bones. After butchering, you might get 1.1 kg of clean fillets. Those 900 grams that have disappeared are the trim waste. If you don’t account for it, you’ll be calculating the dish’s cost as if you had used 100% of the fish, and that is an accounting mirage.
Difference Between Trim Waste and Yield
They are two sides of the same coin. Yield is the percentage of usable product after cleaning and butchering. Trim waste is the exact opposite: the percentage that is lost.
If an ingredient has a 65% yield, its trim waste is 35%. Simple, but understanding this duality is key to building a professional recipe costing sheet. And if you want to measure that figure methodically — weighing gross, trimmed and portioned — follow the guide to the kitchen yield test.
How to Calculate Trim Waste: Gross/Net Formula with a Euro-Based Example
The formula is so simple it’s sometimes undervalued:
Trim Waste (%) = [(Gross Weight - Net Weight) / Gross Weight] × 100
But the real impact is seen when you translate it into euros. Let’s look at a realistic example from a kitchen in Spain in 2026.
Practical Example: Meagre Fillet
Imagine you buy a whole 3 kg meagre at €18.50/kg. The total gross cost is €55.50.
After scaling, gutting, and removing the fillets, you obtain 1.65 kg of net product. Let’s apply the formula:
- Trim Waste = [(3 kg - 1.65 kg) / 3 kg] × 100 = 45%
- Yield = 55%
Now, the real cost calculation per net kilo:
- Total gross cost: €55.50
- Usable net weight: 1.65 kg
- Real cost per net kilo = €55.50 / 1.65 kg = €33.64/kg
Notice the difference: if you had costed your dish using the purchase price (€18.50/kg), you would have undervalued the raw material cost by 82%. This is how many dishes that look profitable on paper end up generating losses on the P&L statement. If you want this worked out in seconds, use the waste and yield calculator; and if the underlying concepts still feel shaky, start with gross weight vs net weight in the kitchen.
This calculation is the heart of recipe costing. If you want to dive deeper into how to structure all your sheets, I recommend you take a look at our complete guide on recipe costing.
ChefBusiness · Real profitabilityMaximize your restaurant without losing moneyCost control and food marketing. Book your ChefBusiness consulting now.Get the consulting →Standard Yield Loss Table for Kitchens
Every ingredient has its own personality. Peeling a potato is not the same as cleaning a beef tenderloin. This table compiles average trim waste percentages in professional hospitality, based on standard quality product and correct butchering techniques. Use it as a starting point for your technical sheets, but remember: you will get the definitive figure by weighing items in your own kitchen.
| Ingredient | Standard Trim Waste (%) | Net Yield (%) | Notes |
|---|---|---|---|
| Fish and Seafood | |||
| Wild turbot (to fillets) | 50-55% | 45-50% | High waste due to head and thick central bone. |
| Farmed sea bass (to fillets) | 40-45% | 55-60% | Higher yield than wild due to its morphology. |
| Large hake (to steaks or fillets) | 35-40% | 60-65% | Depends on head size and cut. |
| Whole salmon (to skinless fillets) | 30-35% | 65-70% | Skin and pin bones represent the greatest loss. |
| Raw king prawn (to peeled tail) | 45-50% | 50-55% | Head and shell weigh almost half. |
| Raw octopus (cleaned, cooked) | 55-60% | 40-45% | Very high waste due to water and viscera. |
| Meats | |||
| Beef tenderloin (cleaned) | 8-12% | 88-92% | Low waste; only surface fat and silverskin are removed. |
| Beef striploin (to T-bone steak) | 15-20% | 80-85% | Includes trimming of cover fat and bone. |
| Iberian pork cheek (cleaned) | 20-25% | 75-80% | Silver skin and external fat are removed. |
| Whole chicken breast (cleaned) | 25-30% | 70-75% | Bone, cartilage, and skin represent the waste. |
| Suckling lamb shoulder (boned) | 30-35% | 65-70% | The bone and excess fat are key. |
| Vegetables | |||
| Fresh artichoke (to heart) | 60-70% | 30-40% | One of the highest waste percentages in vegetable cookery. |
| Green asparagus (to tips) | 35-40% | 60-65% | The woody lower third is the main discard. |
| Roasted red pepper (peeled) | 25-30% | 70-75% | Waste from skin, seeds, and liquid lost during roasting. |
| Potato (peeled and cubed) | 20-25% | 75-80% | Skin and trimmings to regularize the cut. |
| Onion (brunoise) | 12-18% | 82-88% | Outer layers, root, and initial cleaning cut. |
| Sliced mushroom (cleaned) | 10-15% | 85-90% | Earthy stem end and moisture loss. |
| Vine tomato (concassé) | 15-20% | 80-85% | Skin, seeds, and vegetal water. |
| Avocado (to pulp) | 30-35% | 65-70% | Stone and skin represent a third of the weight. |
For whole cuts of meat or fish, the fine-grained analysis is not a single percentage: the same primal yields cuts of very different value. I break down that cost allocation per cut in butchery yields and cost per cut.

How Trim Waste Affects Recipe Costing and Real Food Cost
This is where theory turns into profitability. A recipe costing sheet that ignores trim waste is a beautiful but useless document. Your restaurant’s real food cost depends directly on each technical sheet reflecting the net cost of the ingredient, not the purchase price.
The Most Common Mistake on the Technical Sheet
Many chefs note the purchase price of an already-cleaned tuna loin on their tuna tartare technical sheet. But if you buy tuna in large pieces and clean it yourself, you must apply the corresponding trim waste. If you don’t, the dish cost will be falsified, and your gross margin will be an illusion.
Imagine a dish with a theoretical sheet cost of €4.20 that you sell for €14.00. The theoretical food cost would be 30%. But if the real trim waste of the main ingredient hasn’t been applied correctly and the real cost rises to €5.80, your food cost skyrockets to 41.4%. That 11-percentage-point difference is, literally, the profit you thought you had but don’t.
Integrating Trim Waste into Your Management Software
The good news is that current technology allows you to automate this calculation. Recipe costing software like Miselup lets you assign a trim waste percentage to each ingredient in its master file. This way, when you create a recipe, the system automatically calculates the real net cost, without you having to juggle numbers on a calculator.
Furthermore, linking this data to your inventory allows you to detect deviations. If the theoretical trim waste for your juicing lemons is 40% but your actual consumption indicates 55%, something is happening: either the product has a lower yield than expected, or there is misuse in the kitchen.
If you want to go a step further and monitor your business’s financial health, I invite you to try our free food cost calculator. It will give you a clear view of where you are losing margin. And if you’d rather start today with a ready-made file, download our free recipe costing Excel template, with the waste formula already built in.
Strategies to Minimize Trim Waste Without Losing Quality
Controlling trim waste doesn’t mean using every last bone at the expense of the dish’s quality. It’s about optimizing processes and adding value to by-products.
1. Buy with Yield Criteria in Mind
The cheapest product in gross terms is not always the most profitable. A fish with a lower price per kilo but a disproportionately large head can have a higher net cost than a more expensive one with a better yield. Always compare the cost per net kilo, not per gross kilo.
2. Standardize Cleaning Processes
Train your team with videos and procedure sheets. The difference between a cook who gets a 55% yield from a salmon and another who gets 65% can amount to thousands of euros a year. Standardization is profitability.
3. Find a Use for Trimmings and By-Products
That turbot bone with meat scraps can be the base of a fish fumet. Green asparagus tips can go into a cream soup. Clean meat trimmings are ideal for dark stocks. Every gram you reuse reduces the effective waste and improves your food cost.
4. Review Your Technical Sheets Every Quarter
Purchase prices fluctuate, and the yield of seasonal products does too. An artichoke in March does not have the same trim waste as one in December. Update your recipe costing sheets periodically so they reflect the reality of your kitchen.
AI Chef Pro · AI for chefs55+ AI tools for your kitchenCreate recipes, menus and optimize costs free. Try AI Chef Pro now.Try it free →Frequently Asked Questions
What is the average trim waste for a restaurant?
There is no single figure, but in a well-managed gastronomic restaurant, the global trim waste on total purchases usually ranges between 8% and 15%. This percentage includes waste from cleaning, cooking loss, front-of-house waste, or spoilage.
How is cooking loss calculated?
Cooking loss is the weight loss food undergoes when subjected to heat. It is calculated using the same formula: (Weight before cooking - Weight after cooking) / Weight before cooking × 100. For example, a beef round roast that loses 25% of its weight when oven-roasted. This loss chains with the trimming waste in your costing sheet (the yields multiply rather than add up); the difference between the two — and how to chain them without distorting the cost — is covered in cooking loss vs trimming waste. In bakeries and pastry shops the water lost in the oven matters even more; I break it down in depth in recipe costing for bakeries and pastry shops.
What is the difference between trim waste and spoilage?
Trim waste is inherent to the product and its preparation (bones, skins, scales). Spoilage is avoidable and usually due to poor management: overproduction, expiry dates, plating errors, or poorly adjusted portions. Trim waste is controlled with technical sheets; spoilage, with processes and training.
How often should I update my yield loss table?
Ideally, you should review complete technical sheets with each season change (four times a year). However, if you introduce a new supplier or detect a significant variation in the yield of a key ingredient, update that data immediately. A monthly check on high-value products (prime meats, wild fish) is a recommended practice.
Can I use the same yield loss table for all my suppliers?
It is not recommended. Trim waste can vary depending on breed, diet, origin, and slaughter or catch method. A free-range chicken has more breast trim waste than an industrial one due to its higher bone proportion. Ideally, you should have a reference table and adjust it with your own yield tests for each main supplier.