How to Price a Dish: Your Cost Sets the Floor, the Market Sets the Price
How to price a dish: from plate cost to menu price using target food cost, markup vs margin, and why the market—not just your cost—sets the final price.

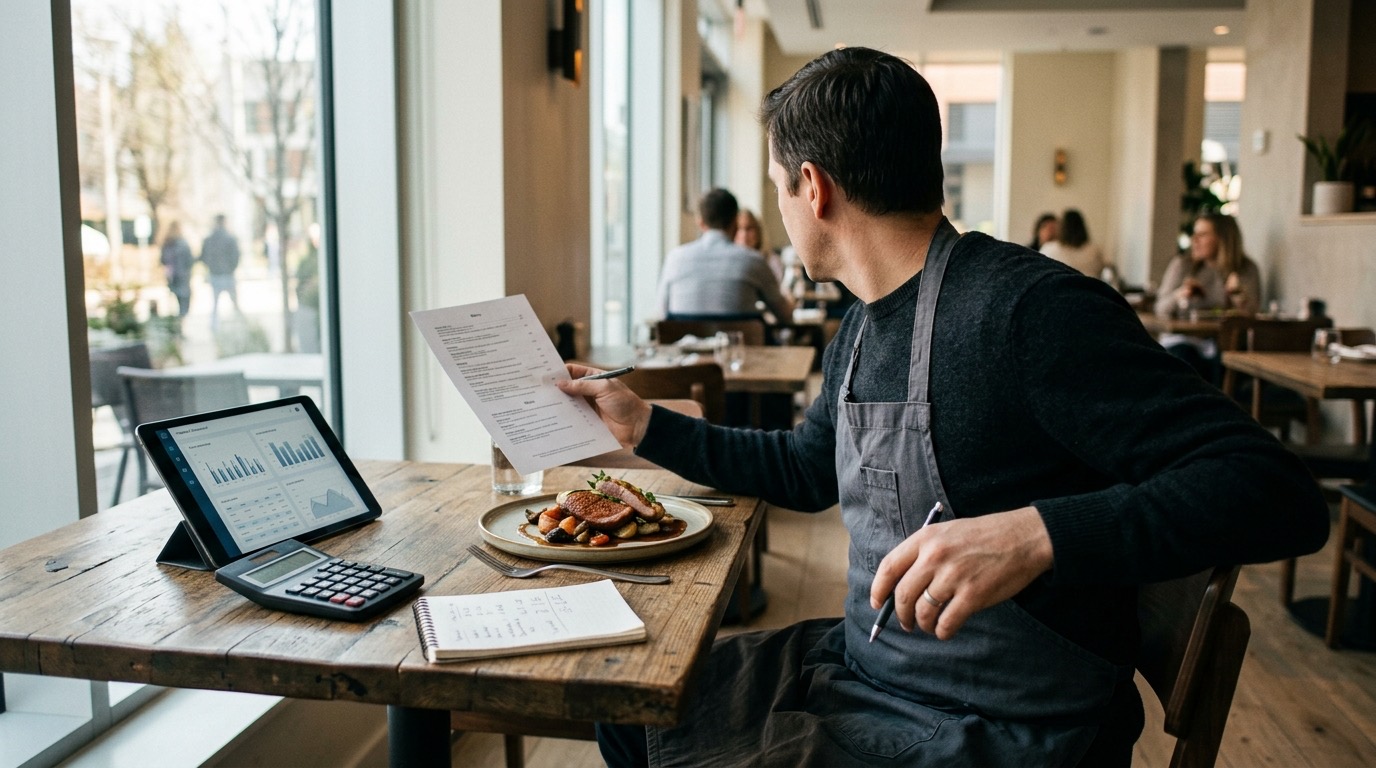
Most operators learn one formula early on: take the plate cost, multiply by three, print the menu. The math feels safe—it yields a 33% food cost, and that’s what the textbooks say. But safe arithmetic is not pricing. It ignores the guest across the table, the competitor down the street, and the value your name carries. This guide won’t hand you a multiplier and send you away. It will walk you through the real sequence: your cost sets the absolute floor, the market draws the ceiling, and what lands on the menu is a disciplined, psychological decision—not a multiplication.
You’ll see numbers, tables, and formulas that make the logic bulletproof. But the bigger win is a shift in how you think: price is a story you tell about what your plate is worth. And that story starts with knowing exactly what the plate costs you—then reading the room.
Timlup · Team on trackDaily checklists & tasks for your restoKeep your team on point with recurring tasks. Meet Timlup and simplify operations.Meet Timlup →What “menu price” really means (cost is not price)
Menu price is the number the guest sees next to the item, the pre-tax dollar amount they commit to before sales tax is added at the register. In the US, all quoted menu prices are pre-tax—state and local taxes are layered on at the point of sale, not baked into the psychology of the price.
Separate two concepts early. Raw food cost (“what it costs me”) is the sum of every ingredient on the plate, worked down to the gram from a recipe-costing exercise. It’s a hard fact—receipts don’t lie. Price (“what it’s worth to the guest”) lives in a different world. It’s shaped by perception, competitors, location, and the experience you wrap around the food. Cost is a floor; price is a market signal. Keep that distinction clear and you’ll stop pricing from the kitchen backward—and start pricing from the market downward.
Your cost is the floor, the market is the ceiling
Think of pricing as a window. The bottom sill is your plate cost—price below it and you lose money on every cover. The top sill is what the market will bear: what your neighbor charges, what the guest’s wallet is willing to part with, and the perceived worth of your dining experience. Between those two sits every profitable menu price you’ll ever print. The work is to find where inside that window you belong, then set a number that feels natural to the guest while grabbing every dollar of margin the market offers. This guide will walk both sides: first, how to anchor the cost floor rigorously; second, how to read the market ceiling and make a pricing decision—not just a calculation.
Markup vs. margin: the costly mix-up
Before you price a single dish, untangle the two measures that trip up even veteran operators. Margin is measured on the selling price. Markup is measured on the cost. They are not the same number, and treating them as interchangeable will quietly underprice your menu.
| Cost | Selling Price | Food Cost % | Gross Margin % | Markup % | |
|---|---|---|---|---|---|
| A dish with a 30% target | $10.00 | $33.33 | 30.0% | 70.0% | 233% |
Gross Margin % = (Price − Cost) ÷ Price
Markup % = (Price − Cost) ÷ Cost
A 70% gross margin sounds like a 70% markup. It isn’t. In the table above, the markup is 233%—restaurants routinely run 200–400% markups on à la carte items because that’s what turns a 25–35% food cost into the gross profit that covers labor, rent, and everything else. If you confuse the two and price by adding a 70% markup to your cost, you’d list that dish at $17.00, a food cost of nearly 59%. The mistake steals margin you can never recover once the menu goes live. Use margin to set targets; use markup only when converting a cost increase into a price adjustment. Keep the formulas on a sticky note.
From plate cost to menu price, step by step (worked example)
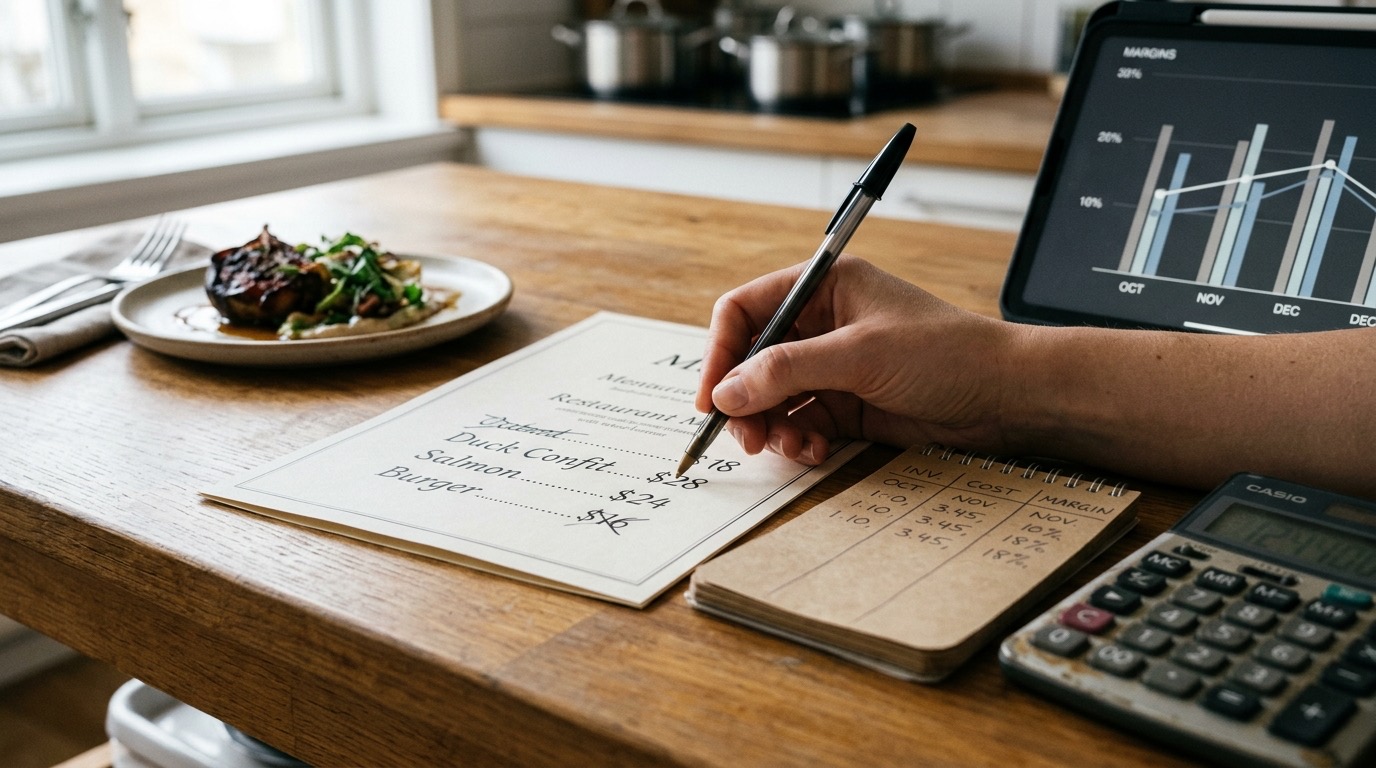
Pricing a dish is a five-step chain. Steps four and five are where most operators stop short; we’ll expand them in the sections that follow, but here’s the full sequence in one breath.
- Start from the plate cost per portion. This number comes from a disciplined recipe-costing process—weighing every ingredient, attaching a purchase price, and dividing by the yield. (Get that right first: see how to cost a recipe step by step.) Let’s use a real example: a braised short rib entrée with sides costs $3.60 to build, all in.
- Apply your target food cost. If your concept runs a 30% food cost, the formula is:
Menu Price = Plate Cost ÷ Target Food Cost
$3.60 ÷ 0.30 = $12.00.
That’s your cost-driven floor—the price below which you’d be giving away food. The implied multiplier is ×3.33, the markup is +233%, and the gross margin is 70%.
(In the US, sales tax is never included in this figure—the $12.00 is the menu price the guest sees.) - Check it against the market price. You research comparable short rib dishes in your trade area. None sit below $14; the typical range is $14–$15. Your $12.00 floor is safe, but it leaves money on the table.
- Set a psychological price within the band. The market ceiling is roughly $15. You choose $13.95, a charm price that sits just under $14, feels like a value, sitting just under the $14-$15 competitive band.
- Backward-check your food cost.
Food Cost = $3.60 ÷ $13.95 = 25.8%, gross margin = 74.2%, still well under the $15 ceiling.
The purely arithmetic price was $12.00. The market had room up to ~$15, so pricing at $13.95 improves your food cost from 30% to 25.8% while keeping you competitive. The market handed you extra margin above the cost floor. Use our menu price calculator to model this instantly—and for a deep dive into how those plate-cost pennies are built, see how much does it cost to make a pizza, a full costing walkthrough.
The market sets the price, not your spreadsheet
Your recipe cost gave you a floor of $12.00. The spreadsheet stops there. But price is a social contract—it’s determined by three forces that sit outside your kitchen.
Local competition is the most visible ceiling. A guest deciding where to eat will, consciously or not, compare your dish to a similar one nearby. If every short rib in the neighborhood lands between $14 and $15, a $12.00 price signals “cheap,” not “smart”—and a $17.00 price signals “presumptuous” unless you’ve built a reputation that justifies it.
The guest’s willingness to pay is the emotional layer. Two restaurants can serve the exact $3.60 plate cost and both be completely legitimate: a lunch counter might price it at $9 and turn tables fast on volume, while a date-night spot with candles, a wine list, and a view can ask $18. The cost is identical; what changed is the willingness to pay, shaped by atmosphere, occasion, and story.
Perceived value wraps product, plating, location, brand, and experience into a single impression that lives in the guest’s head before they take a bite. High perceived value widens the gap between cost and price. It’s what lets a tasting-menu restaurant charge three figures for a dish that, ingredient-wise, costs no more than a gastropub’s special. It’s also fragile—slip on execution or service, and the guest mentally lowers the ceiling.
When the ceiling leaves room above your floor, price up—not to the limit, but to a point where the guest still feels the value while you capture the margin the market has already priced in for you. When the market ceiling is tight and presses down against your cost floor, you have one ethical move: cut the plate cost, not the perceived quality. Swap a costly garnish, adjust portion weight by half an ounce, rework a side—all before you consider touching the guest-facing experience. Your cost sets the floor, but the market sets the price. Your job is to build the dish so the two never collide. And remember that this band shifts with the sales channel: if you run a food truck or a dark kitchen, delivery platform commissions and packaging costs change the equation, and you’ll almost always want a delivery price that differs from your dine-in price—I walk through it in recipe costing for food trucks and ghost kitchens.
ChefBusiness · Real profitabilityMaximize your restaurant without losing moneyCost control and food marketing. Book your ChefBusiness consulting now.Get the consulting →Psychological menu pricing
Cost anchors the floor; the market defines the ceiling. Between those two numbers sits a band where how you present the price influences what a guest is willing to pay — without changing the underlying cost structure or your target margin.
Charm pricing uses endings like .95 or .99 instead of rounding up. A dish priced at $13.95 reads as “thirteen-something” rather than “fourteen dollars.” The brain anchors on the leftmost digit, so the perceived gap between $13.95 and $14.00 is larger than the five cents would suggest. For a menu built on a 30% food cost, that nickel can move the final price from a clean $14.00 to $13.95 while keeping the gross margin almost identical.
Drop the dollar sign on the menu. The currency is assumed the moment a guest sits down; the symbol acts as a visual trigger that reinforces the “pain of paying.” Removing it — simply writing 13.95 — reduces that friction. Experiments in consumer psychology suggest that guests spend more when the currency symbol is absent, because the number becomes a score rather than a cost.
Anchoring places a clearly pricier dish first or in the most prominent spot. When the first item a guest sees is a $34 dry-aged ribeye, the $23 pasta that follows feels reasonable. The expensive anchor reframes the rest of the menu without requiring you to lower any price. The anchor itself may sell in modest volume, but it lifts the perceived value of the entire menu.
Avoid right-aligned price columns. When every price sits in a straight vertical line, guests scan straight down the column and pick the cheapest option. Break the alignment — tuck the price at the end of the description, in the same typeface, so the guest reads the dish first. “Seared yellowfin tuna with smoked sea salt, charred lemon, and caper butter 19.95” forces the decision to start with the food, not the number.
Sensory descriptions raise perceived value. Describing a dish in terms of flavor, texture, and provenance creates a mental picture that justifies the price. “Pan-seared yellowfin tuna with smoked sea salt” supports a higher price than “tuna with sauce.” The difference is wholly psychological, but it widens the band between floor and ceiling. Psychological pricing positions the number within that band; it does not replace the cost math. Master the cost first, then wrap the number in the right presentation.
Menu engineering: price by profitability and popularity
Pricing a single dish is a start. Managing the entire menu as a profitable system is the move that separates a restaurant that merely survives from one that builds real margin. Menu engineering crosses two dimensions: contribution margin (profitability) and sales mix (popularity). Every dish falls into one of four quadrants.
| High margin | Low margin | |
|---|---|---|
| High sales | Star | Plowhorse |
| Low sales | Puzzle | Dog |
Stars (high margin, high sales): Protect them. Never discount a Star. Keep them in the most visible menu position, and guard their food cost as if your lease depends on it — because it does. A recipe spec sheet locks every Star’s ingredient quantities and cost, so a line cook’s heavy hand or a supplier change doesn’t silently erode the margin.
Plowhorses (low margin, high sales): These drive volume but eat margin. Raise the price gently — a 3–5% increase on a dish that sells 50 units a night adds up without alarming guests. At the same time, attack the cost: renegotiate the supplier, adjust the portion size by half an ounce, or swap a high-cost garnish for something that reads just as well on the plate. The goal is to shift a Plowhorse toward Star territory without losing its identity.
Puzzles (high margin, low sales): These are profitable but nobody orders them. Promote them. Move the item to a better position on the page, rewrite the description with sensory language, or add a server recommendation. A Puzzle that becomes a Star changes the profit profile of the entire menu.
Dogs (low margin, low sales): Redesign or remove. Every Dog on the menu consumes prep labor, inventory space, and a line on the page that could hold a potential Star. Cut ruthlessly. A menu with four strong Stars and a handful of Plowhorses will outperform a bloated menu with ten Dogs every shift.
The output of menu engineering is an average gross margin target for the whole menu, not a one-size-fits-all multiplier. You might price a Star at a 25% food cost (75% margin) and let a Plowhorse run at 33% food cost, as long as the blended margin across the mix hits your target. Price the system, not the dish.
Common menu-pricing mistakes
1. Multiplying cost by 3 blindly without checking the market. A ×3 multiplier on a $6.00 plate cost yields $18.00. If every comparable dish in the neighborhood is priced at $14.00, you’re over the ceiling. If the market comfortably supports $22.00, you’re leaving money on the table. The multiplier is a starting point, not a rule.
2. Confusing markup and margin and underpricing. A 30% food cost equals a 70% gross margin, which requires a 233% markup. Applying a 30% markup instead of a 30% food cost gives a price of $4.68 on a $3.60 plate — barely covering the ingredients. The math must be precise.
3. Forgetting that a posted price must cover everything. A price that only covers food cost leaves nothing for labor, rent, insurance, and profit. A too-low food cost target — say, 22% — may produce a price that looks right on paper but fails to generate enough total dollars to cover the rest of the P&L. The price must fund the entire operation.
4. Not updating prices when costs rise. When avocado prices double overnight, a menu that keeps the same price for guacamole is shrinking its margin every day. A delayed increase is a self-inflicted pay cut.
5. Copying the restaurant next door without knowing their cost structure. A competitor’s $16 burger might be built on a different supply chain, a different labor model, or a different volume play. Their price is not your price.
6. Ignoring trim and waste in the plate cost. A 10 oz portion of cleaned fish that started as a 14 oz fillet carries a 29% trim loss. If the cost calculation uses the 14 oz purchase price without accounting for the lost weight, the plate cost is understated, and the price is too low from the start.
7. Applying the same multiplier to every dish regardless of perceived value or sales volume. A steak that guests perceive as a premium item can carry a lower food cost percentage than a side of fries. Pricing every dish at a flat 30% food cost ignores the demand curve that menu engineering is built to exploit.
Updating prices without losing guests
Price changes are a fact of operating a restaurant. How you execute them determines whether guests notice the number or the value.
Review at least quarterly. Set a recurring calendar appointment. Compare current purchase prices against the costs in your recipe database. A quarterly cadence catches creep before it becomes a crisis.
Raise in small, frequent steps. A $0.50 increase every six months is less jarring than a $2.00 jump once every two years. The guest’s memory of the old price fades faster than you think, and the small bump rarely triggers a “that’s gotten expensive” reaction.
Use a menu redesign to reposition prices. A new menu format, a seasonal update, or even a refreshed layout gives you a clean slate. Guests compare the new price to the new presentation, not to the old number. A “new menu” is a natural permission slip for a revised price structure.
Watch the gap between theoretical and actual food cost. A price that looks right on the spreadsheet can fall apart on the line. If your theoretical food cost is 30% and your actual is 34%, you’re losing 4 points of margin to waste, over-portioning, or theft. Fixing that gap often recovers more profit than a price increase would. See theoretical vs. actual food cost for the full breakdown.
Raising the right amount on time protects margin better than cutting quality. Guests forgive a $0.50 increase faster than a dish that no longer tastes the same. Keep the math honest, move early, and the guest stays with the food, not the arithmetic.
Price your menu automatically (no spreadsheets)
When a supplier raises a price on a Friday afternoon, the recommended menu price for every dish using that ingredient should update instantly. A living recipe database — where each ingredient’s cost is current and each spec sheet is locked — recalculates plate cost, suggested price, and gross margin in real time. No pivot tables, no manual updates, no “I’ll fix it next week.”
The flow is straightforward: build the recipe, cost it, set the target food cost percentage, and the system computes the price. Every time a cost changes, the math reruns. See the full workflow in recipe costing for selling price and margins. For a quick estimate on a single dish, the menu price calculator gives you a starting number in seconds. If you’re ready to stop wrestling with spreadsheets, try Miselup and let the platform handle the recalculations while you focus on the food.
AI Chef Pro · AI for chefs55+ AI tools for your kitchenCreate recipes, menus and optimize costs free. Try AI Chef Pro now.Try it free →Frequently asked questions
How do you price a dish?
Start with the exact plate cost — every ingredient, portioned, with trim and waste accounted for. Divide that cost by your target food cost percentage (e.g., $3.60 ÷ 0.30 = $12.00). Then check the market ceiling: the final price must sit between that cost floor and what a guest is willing to pay. Adjust for psychological presentation and the dish’s role on the menu.
What is a good food cost percentage?
A typical target is 28–35%, depending on the concept. A steakhouse runs lower (around 28%) because the entrée carries the margin; a pizza shop often runs higher (32–35%) because volume makes up the difference. A 30% food cost is a common starting point, leaving a 70% gross margin to cover labor, overhead, and profit.
What’s the difference between markup and margin?
Margin is the percentage of the menu price that is gross profit: a 30% food cost means a 70% gross margin. Markup is the percentage above cost: to achieve a 30% food cost, you need a 233% markup — i.e. you multiply the cost by 3.33 ($3.60 × 3.33 = $12.00). Confusing the two — applying a 30% markup instead of a 30% food cost — leads to severe underpricing.
How much do restaurants mark up food?
Markups commonly range from 200% to 400%, which translates to a food cost of 33% (a 200% markup) down to 20% (a 400% markup). The exact markup depends on the category, the perceived value of the dish, and the restaurant’s overall cost structure. A 300% markup (25% food cost) is typical for an entrée with high perceived value.
What is value-based pricing in a restaurant?
Value-based pricing sets the price according to what the guest believes the dish is worth, not just what it costs to produce. That belief is shaped by the menu description, the ingredients, the presentation, and the dining environment. It operates within the band between the cost floor and the market ceiling; the stronger the perceived value, the higher the price can climb within that band.
How do you use psychological pricing on a menu?
Use charm pricing (end in .95 or .99), remove the dollar sign, place a high-priced anchor item first, and avoid right-aligned price columns. Sensory descriptions elevate perceived value — “hand-cut, dry-aged ribeye” justifies a price that “beef steak” cannot. These techniques position the number without altering the underlying cost or margin.
How often should I update menu prices?
At least quarterly, and any time a key ingredient cost moves significantly. Frequent small increases keep the menu aligned with costs without shocking guests. A quarterly review, paired with a menu engineering exercise, ensures the entire menu works as a profitable system.
What is menu engineering?
Menu engineering is the practice of managing a menu’s overall profitability by categorizing every dish based on its contribution margin and sales volume. Dishes fall into four categories: Stars (high margin, high sales), Plowhorses (low margin, high sales), Puzzles (high margin, low sales), and Dogs (low margin, low sales). The goal is to maximize the blended gross margin by protecting Stars, improving Plowhorses, promoting Puzzles, and cutting Dogs.