The traffic light: reading the colors of your profitability
Green, amber or red: what each color means for food cost, margin and profit, and what to check every week.
Updated on September 3, 2026
What is Miselup’s traffic light?
It is the color code Miselup uses to mark where you need to look. It shows up on the key figures under P&L management → Dashboard and on the General → Profitability screen. The thresholds are the same for everyone: green is fine, amber means watch it, red means act.
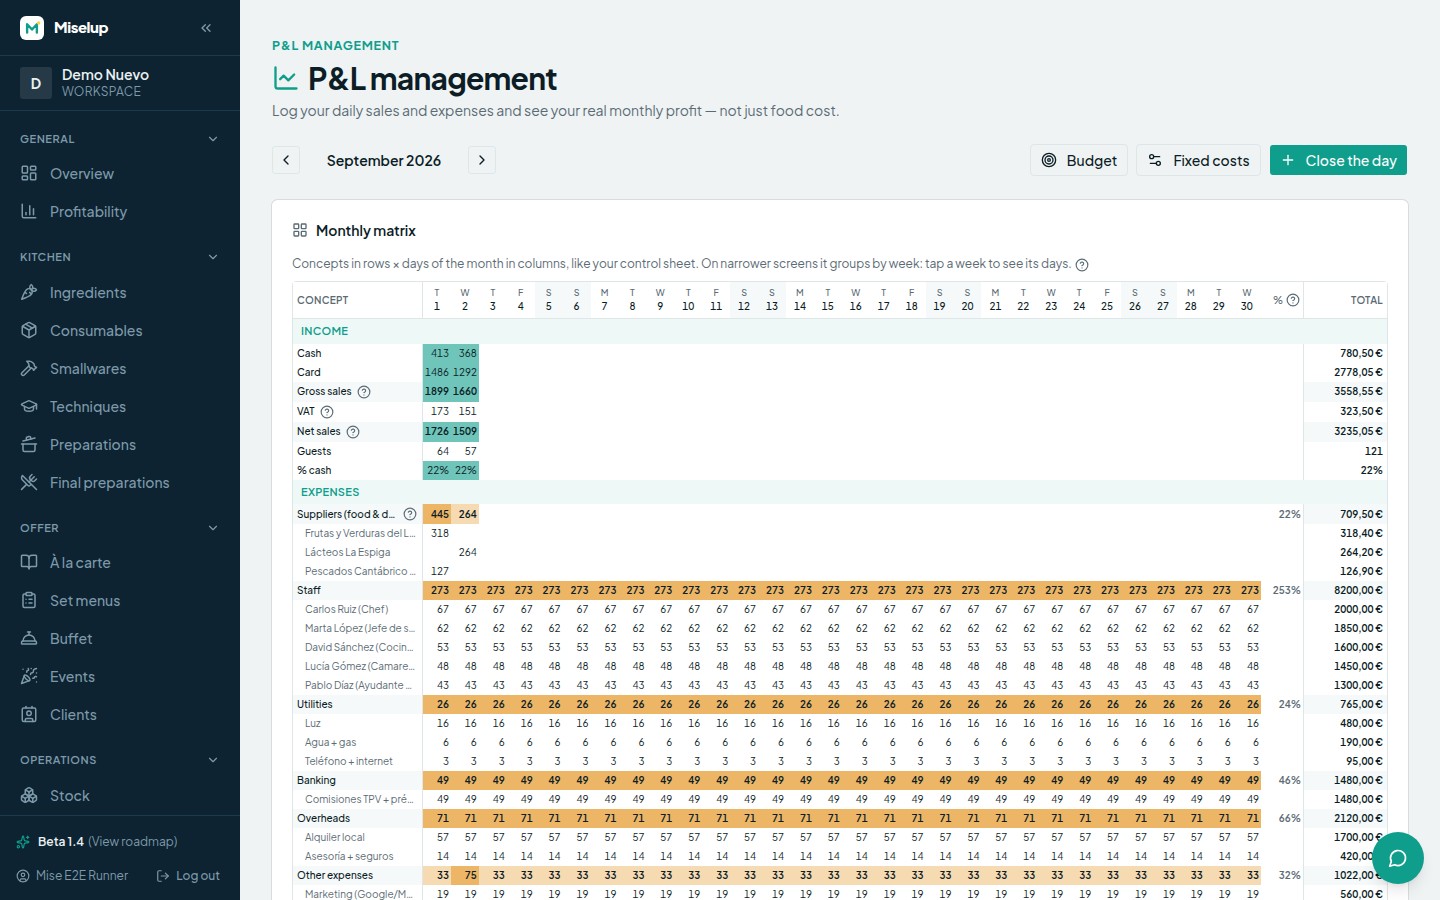
When does the month’s food cost turn red?
On the «This month» card in P&L management, the «Food cost» indicator is the cost of raw materials (the «Suppliers (food & drink)» block) divided by your net sales. Its traffic light:
- Green: up to 30%.
- Amber: from 31% to 40%.
- Red: above 40%.
The healthy hospitality benchmark Miselup uses is staying below 30–35%.
And labor cost?
The «Staff» indicator on «This month» is the «Staff» expense block divided by your net sales, and it has a tighter traffic light than food cost:
- Green: up to 30%.
- Amber: from 31% to 35%.
- Red: above 35%.
What colors does profit have?
«Month profit» and «Today’s profit» only have two states: green when it is positive and red when it is negative. When it is negative, the whole card is highlighted in red. In P&L management the profit is real —net sales minus every expense, prorated fixed costs included—, so a red there means you are losing money that month.
Next to each figure you will see a ▲/▼ pill with the change against the previous month (or against yesterday). Don’t just look at the arrow: the color already interprets the direction — under «Expenses», going down is the good news and shows green.
What do the colors in «Profitability per recipe» mean?
Under General → Profitability, the «Profitability per recipe» table colors two columns with a traffic light. «Margin» (over selling price): green from 60% up, amber from 40% to 59%, red below 40%. The recipe’s «Food cost»: green up to 30%, amber from 31% to 40%, red above 40%. The table sorts by ascending margin, so your worst recipes come out on top without you having to go looking for them.
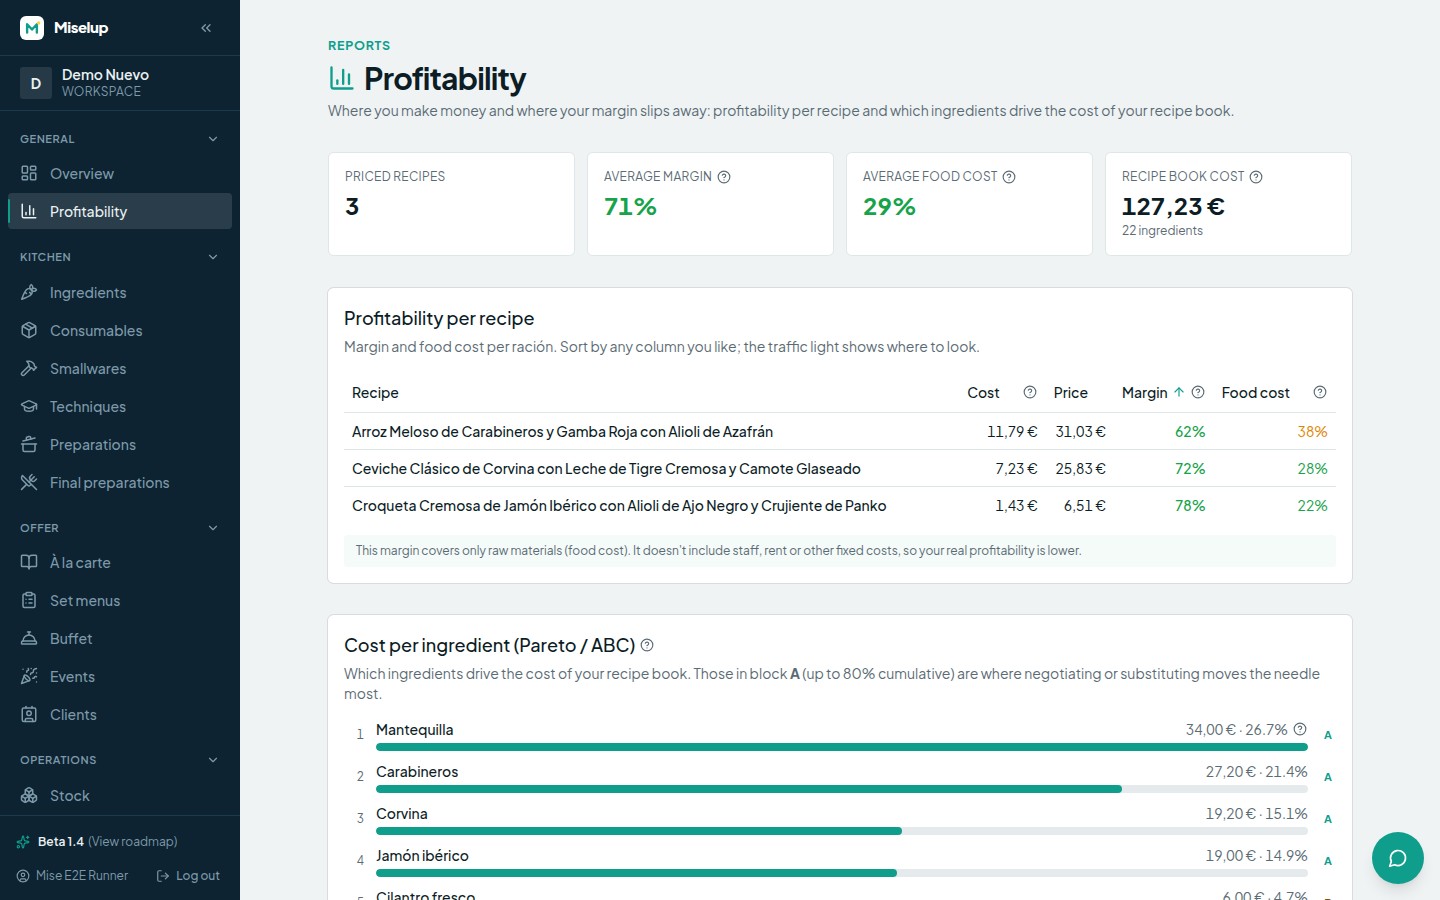
Below it, «Cost per ingredient (Pareto / ABC)» labels each ingredient by the cost it concentrates in your recipe book: A up to 80% cumulative, B up to 95% and C the rest. Negotiating or substituting the ones in block A is what moves your food cost the most.
What should I be checking every week?
- The break-even point in P&L management: if it says «You need X more to cover costs» and there are few service days left, you have a sales problem.
- «Profit per day»: look for the days in red and cross-check them against that day’s staffing.
- «Food cost» and «Staff» on «This month»: they are your two big costs; with both in amber the month no longer adds up.
- «Monthly budget»: check which blocks carry the variance pill in red. If you haven’t budgeted yet, look at «Where the money goes».
- General → Profitability: open the two or three recipes in red and decide on price, recipe or menu.
Known limits
- The traffic-light thresholds are fixed: they can’t be customized per business. They are a general industry benchmark, not your own house rule.
- The margin you see on a costing covers raw materials only: it doesn’t include staff, rent or fixed costs, so your real profitability is lower. When you have data loaded in P&L management, Miselup also shows you the «Real margin», with your operating cost already deducted.
- Recipes with no selling price have no margin and no food cost: they show as «—» and are counted separately on the «Priced recipes» card.
- Profitability and the Pareto only count your own recipes. Stock-catalog dishes you haven’t customised are left out of the report: edit the ones you use (your own copy gets created) and they come in on their own.
- The break-even point needs the month’s data: with no sales or expenses loaded you will see «Log sales and expenses to compute your break-even».
- P&L management and the profitability reports are on the Mise Pro plan; compare plans at miselup.pro/en/pricing.
Was this article helpful?
Thanks! This helps us improve the help center.
Related articles
-
Closing the day: sales, expenses and real profit
Enter the day's sales and expenses in P&L management and see straight away whether the day made you a profit or a loss.
-
Fixed costs, opening days and your monthly budget
Enter your fixed costs and your budget: Miselup spreads them across the days you open and compares what you planned with what really happened.
-
Food cost and margin: the exact formulas
Where the cost per serving, the food cost %, the margin and the suggested price come from, and what each color is telling you.
Can't find what you're looking for?
Write to us and a real person from the team replies — no bots in the way when you need to talk.
Contact the team